Are results weighted?
Yes. By default, all statistics use the sample weight provided for each selected sample. If a sample has no weight, its results are unweighted.

Short answers to common questions about using the Online Data Analysis (ODA). Use the index on the right to jump to a question.
Yes. By default, all statistics use the sample weight provided for each selected sample. If a sample has no weight, its results are unweighted.
Yes. You can export tables and charts to Excel (.xlsx), PDF, or download a PNG snapshot.
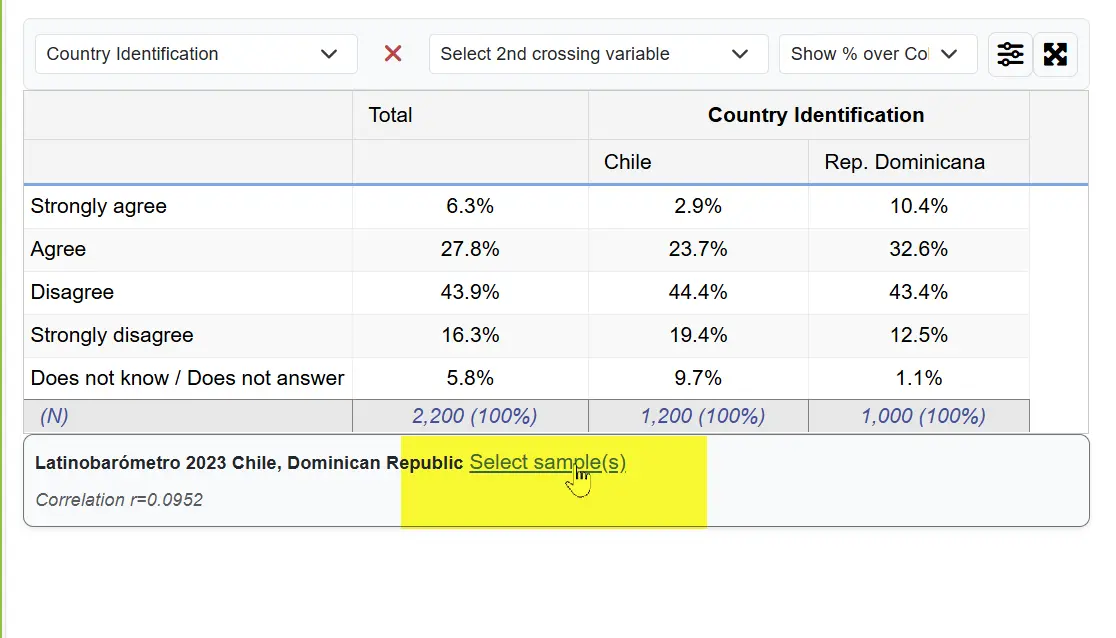
Yes. Use the Selected samples control shown beneath the results to open the selector and add or remove countries/regions.
Tip: Select only the countries you really want to compare — very large tables can be slower to generate and harder to read.
Yes. You can produce and export your own figures and tables. Please cite Latinobarómetro as recommended in the Data & Documentation section.
Percentages are calculated over the (weighted) number of valid responses for the selected category. “Don’t know/No answer” can be excluded when running a cross-tabulation.
By default you will see percentages over column totals, but you can switch to row totals, sample totals, or show absolute values.
Rounding, multi-response items, or excluded missing values can lead to totals slightly above or below 100%. When weights are applied, totals may also vary slightly.
By default, “Don’t know/No answer/Refused” are included in calculations. You can exclude them by clicking the MV button above the chart.
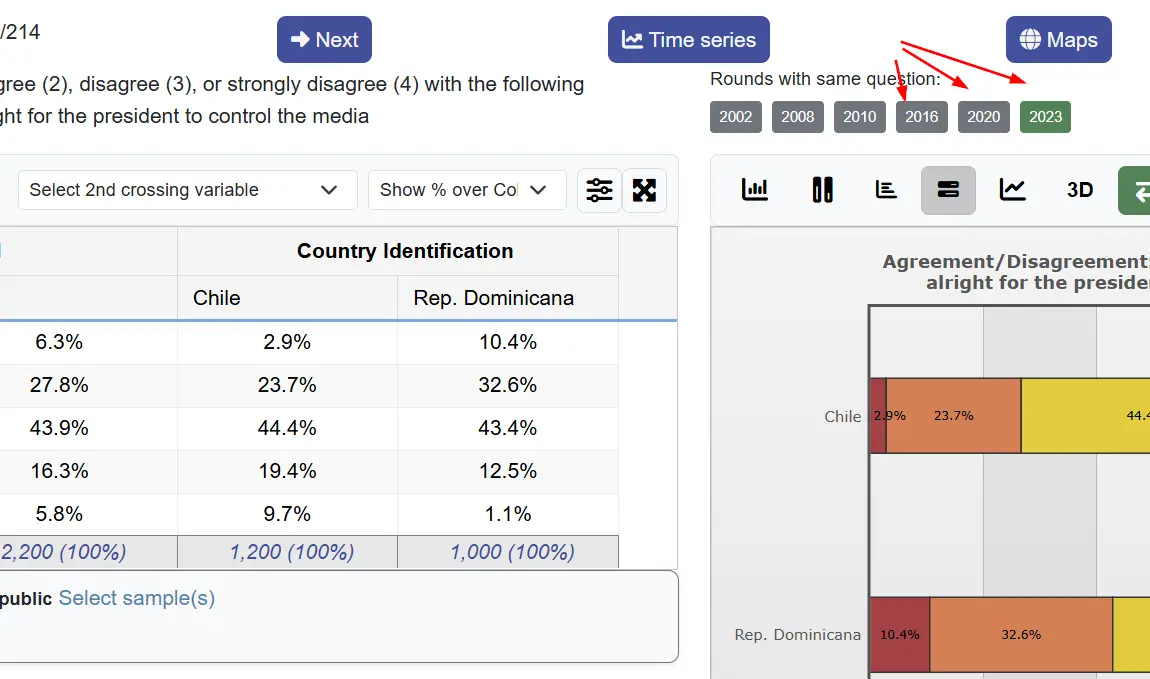
Yes. Two ways: use the Round buttons to see results in different waves where the same question was asked, or switch to the Time Series view using the top button.
Not always. Some items may not be fielded in every wave. You can see where a variable was asked by checking the Round buttons (Wave 1, Wave 2, Wave 3, …) shown above the chart options.
ODA reports descriptive statistics. For inference (e.g., tests or models), export your results and use statistical software.
The base is the weighted count of valid cases after applying filters and sample selection. The Ns displayed refer to this base.
Very large selections (many countries/waves or many categories) take longer to compute. Reduce the number of samples or collapse categories to speed up rendering.
Recent versions of major browsers are recommended. For large tables, a desktop browser provides the best experience.
Please use the citation format provided for the study you are using. See Study level downloads.